
Q. The hyetograph of a storm event of duration 140 minutes is shown in the figure.
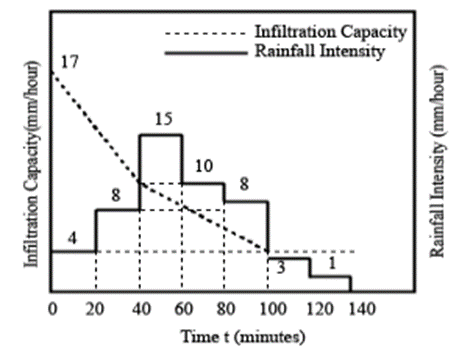
The infiltration capacity at the start of this event (t = 0) is 17 mm/hour, which linearly decreases to 10 mm/hour after 40 minutes duration. As the event progresses, the infiltration rate further drops down linearly to attain a value of 4 mm/hour at t = 100 minutes and remains constant thereafter till the end of the storm event. The value of the infiltration index, ϕ(in mm/hour, round off to 2 decimal places), is
Solution:
Depth of infiltration = Area of hyetograph above Horton’s curve
=(15×20/60+10×20/60+8×20/60)−10+4/2×60/60
=4 mm
Now, assuming
4≤ϕ≤8
(8−ϕ)×20/60+(15−ϕ)+20/60+(10−ϕ)×20/60
+(8−ϕ)×20/60=4
41−4ϕ=12
⇒ϕ=7.25 mm/hr


![Determine the correctness (or otherwise) of the following Assertion [A] and the Reason [R]](https://www.gkseries.com/blog/wp-content/uploads/2023/10/Determine-the-correctness-or-otherwise-of-the-following-Assertion-A-and-the-Reason-R.jpg)