
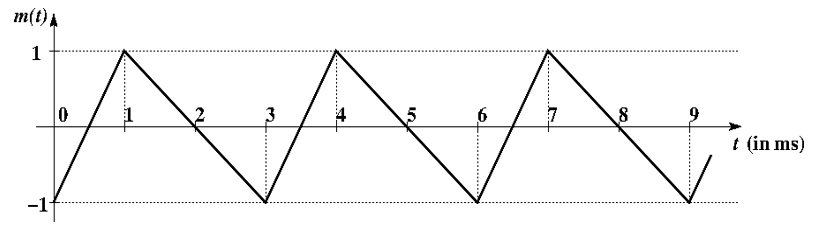
Q. The baseband signal 𝑚(𝑡) shown in the figure is phase-modulated to generate the PM signal 𝜑(𝑡) = cos(2𝜋𝑓𝑐𝑡 + 𝑘 𝑚(𝑡)). The time 𝑡 on the x-axis in the figure is in milliseconds. If the carrier frequency is 𝑓𝑐 = 50 kHz and 𝑘 = 10𝜋, then the ratio of the minimum instantaneous frequency (in kHz) to the maximum instantaneous frequency (in kHz) is (rounded off to 2 decimal places).
Ans: 0.74 – 0.76


![Determine the correctness (or otherwise) of the following Assertion [A] and the Reason [R]](https://www.gkseries.com/blog/wp-content/uploads/2023/10/Determine-the-correctness-or-otherwise-of-the-following-Assertion-A-and-the-Reason-R.jpg)