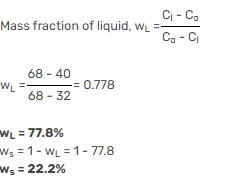
Q. The binary phase diagram of metals P and Q is shown in the figure. An alloy X containing 60% P and 40% Q (by weight) is cooled from liquid to solid state. The fractions of solid and liquid (in weight percent) at 1250 °C, respectively, will be

Ans: 22.2% and 77.8%
Sol:


![Determine the correctness (or otherwise) of the following Assertion [A] and the Reason [R]](https://www.gkseries.com/blog/wp-content/uploads/2023/10/Determine-the-correctness-or-otherwise-of-the-following-Assertion-A-and-the-Reason-R.jpg)