Directions: Read the following information carefully and answer the questions given below.
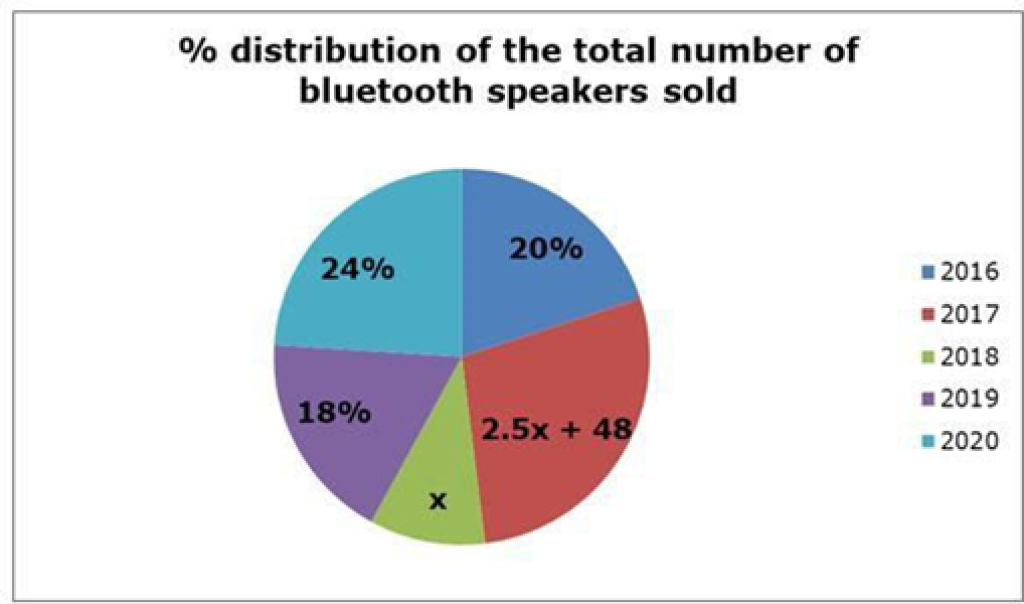
The given pie chart shows the percentage distribution of the total number of bluetooth speakers sold in a shop in five different years namely 2016, 2017, 2018, 2019 and 2020.
Note:
If the number of bluetooth speakers sold in every year is greater than 300, then the ratio of the number of bluetooth speakers sold to outdoor speakers sold is 8:11, or else the ratio is 4:5. The difference between the number of bluetooth speakers sold in 2017 and 2018 is 288.
1) Find the difference between the total number of bluetooth and outdoor speakers sold in 2017 and the number of outdoor speakers sold in 2020.
a) 542
b) 536
c) 456
d) 486
e) None of these
Sol:
Required difference = (448 + 616) – 528 = 1064
– 528 = 536
2) If the number of bluetooth speakers sold in 2021 is 25% more than that of in the previous year and the number of outdoor speakers sold in 2021 is 20% more than that of 2018, find the total number of bluetooth and outdoor speakers sold in 2021.
a) 780
b) 650
c) 700
d) 720
e) None of these
Sol:
Number of bluetooth speakers sold in 2021 =
384 * 125/100 = 480
Number of outdoor speakers sold in 2021 = 200 *
120/100 = 240
Total number of bluetooth and outdoor speakers
sold in 2021 = 480 + 240 = 720
3) The number of bluetooth speakers sold in 2016 is what percentage more/less than the number of outdoor speakers sold in 2018?
a) 80% more
b) 60% more
c) 100% more
d) 75% more
e) None of these
Sol:
Required percentage = (320 – 200)/200 * 100 =
120/200 * 100 = 60% more
4) If the number of ceiling speakers sold in 2016 is the average of the number of bluetooth and outdoor speakers sold in the same year and the ratio of the number of ceiling speakers to bluetooth speakers sold in 2018 is 9:4, then find the difference between the number of ceiling speakers sold in 2016 and 2018.
a) 18
b) 20
c) 15
d) 30
e) None of these
Sol:
Number of ceiling speakers sold in 2016 = (320 +
440)/2 = 760/2 = 380
Number of ceiling speakers sold in 2018= 160 *
9/4 = 360
Required difference = 380 – 360 = 20
5) Find the ratio of the number of bluetooth speakers sold in 2018 to the number of outdoor speakers sold in 2016.
a) 3:5
b) 11:4
c) 7:5
d) 4:11
e) None of these
Sol:
Required ratio = 160:440 = 4:11


