Q. A PERT project network consists of 5 activities A to E. The time estimates of these activities follow Beta-distribution. The predecessor–successor (P-S) relationships between the nodes and time estimates of activities are given in table
| Activity | P-S | Optimistic time (days) | Most likely time (days) | Pessimistic time (days) |
| A | 1 – 2 | 2 | 4 | 6 |
| B | 2 – 3 | 4 | 5 | 12 |
| C | 2 – 4 | 5 | 8 | 11 |
| D | 3 – 5 | 2 | 5 | 08 |
| E | 4 – 5 | 4 | 6 | 14 |
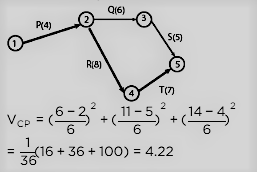
The variance (in days) of the critical path is _ (round off to 2 decimal places)
Ans:
Sol:


![Determine the correctness (or otherwise) of the following Assertion [A] and the Reason [R]](https://www.gkseries.com/blog/wp-content/uploads/2023/10/Determine-the-correctness-or-otherwise-of-the-following-Assertion-A-and-the-Reason-R.jpg)
