Q. In the figures, Group I represents the atmospheric temperature profiles (P, Q, R and S) and Group II represents dispersion of pollutants from a smoke stack (1, 2, 3 and 4). In the figures of Group I, the dashed line represents the dry adiabatic lapse rate, whereas the horizontal axis represents temperature and the vertical axis represents the altitude.
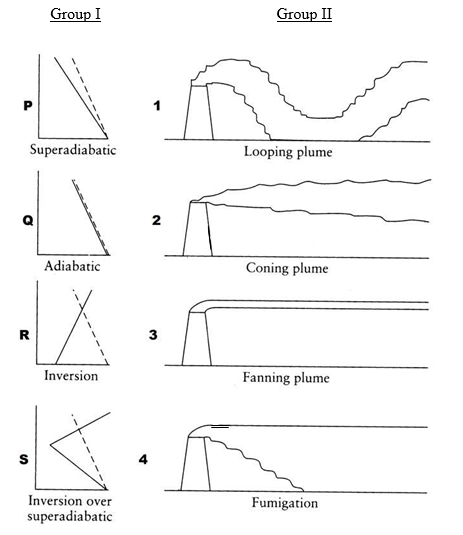
The correct match is
(A) P-1, Q-2, R-3, S-4
(B) P-1, Q-2, R-4, S-3
(C) P-1, Q-4, R-3, S-2
(D) P-3, Q-1, R-2, S-4
Ans: P-1, Q-2, R-3, S-4


![Determine the correctness (or otherwise) of the following Assertion [A] and the Reason [R]](https://www.gkseries.com/blog/wp-content/uploads/2023/10/Determine-the-correctness-or-otherwise-of-the-following-Assertion-A-and-the-Reason-R.jpg)