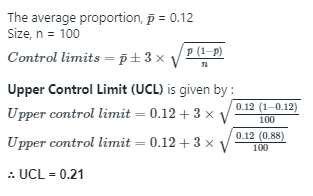
Q. The average proportion non-conforming of 20 samples each of size 100 items is 0.12. The upper control limit for the relevant chart is ____(round off to 2 decimal places)
Ans: 0.21 – 0.23
Sol:
Q. The average proportion non-conforming of 20 samples each of size 100 items is 0.12. The upper control limit for the relevant chart is ____(round off to 2 decimal places)
Ans: 0.21 – 0.23
Sol:
![Determine the correctness (or otherwise) of the following Assertion [A] and the Reason [R]](https://www.gkseries.com/blog/wp-content/uploads/2023/10/Determine-the-correctness-or-otherwise-of-the-following-Assertion-A-and-the-Reason-R.jpg)