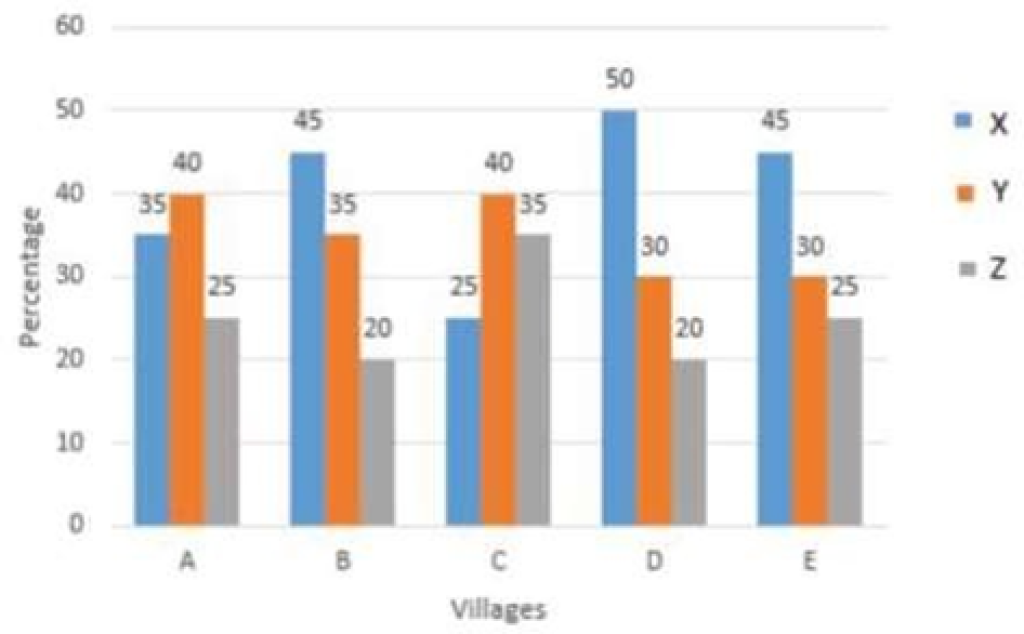
The given Bar Graph represents the percentages of population in the age groups, X(above 50years)

The given Bar Graph represents the percentages of population in the age groups, X(above 50years), Y(20to 50years), Z(below 20 years) in five different villages, A, B, C, D and E with total population of 5000, 6000, 8000, 4500 and 6000 respectively.

What is the ratio of the total number of persons of ages above 50 years in the villages, B and C, taken together to the total number of persons having ages between 20 and 50 years in the said villages?
(a) 49:57
(b) 47:53
(c) 51:59
(d) 24:27
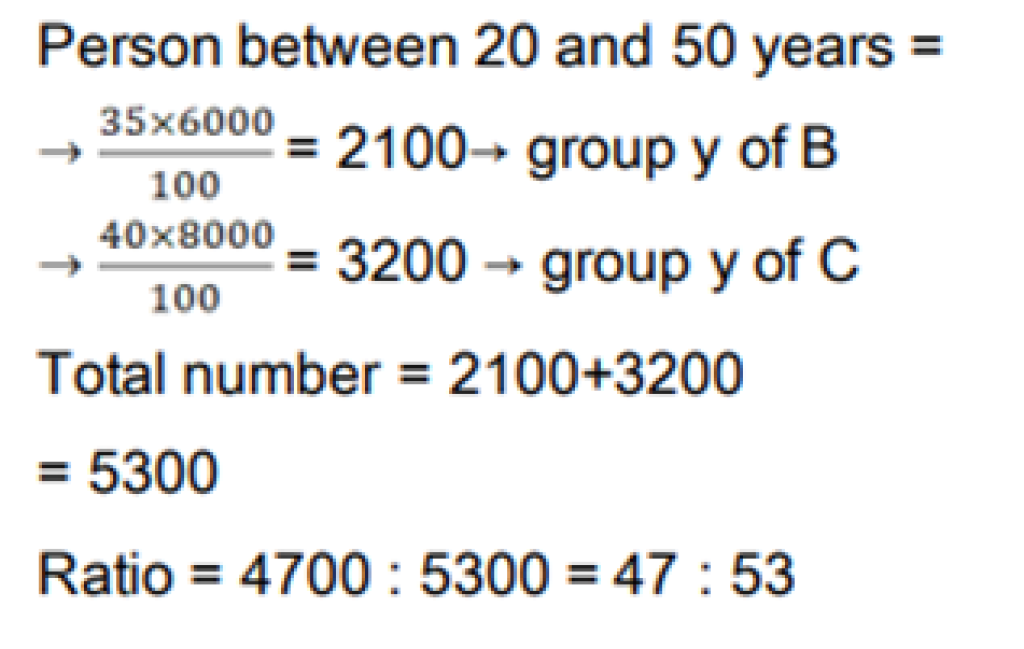
Sol:
Person above 50 years =

Total number = 2700+2000
=4700
