Q. The table presents the demand of a product. By simple three-months moving average method, the demand-forecast of the product for the month of September is
| Month | Demand |
| January | 450 |
| February | 440 |
| March | 460 |
| April | 510 |
| May | 520 |
| June | 495 |
| July | 475 |
| August | 560 |
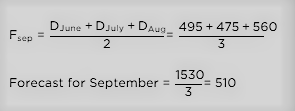
(A) 490 (B) 510 (C) 530 (D) 536.67
Sol:


![Determine the correctness (or otherwise) of the following Assertion [A] and the Reason [R]](https://www.gkseries.com/blog/wp-content/uploads/2023/10/Determine-the-correctness-or-otherwise-of-the-following-Assertion-A-and-the-Reason-R.jpg)